Today, we take a closer look at the relationship between year of completion (as a rough proxy for time) and employment – specifically, patterns of tenure/tenure-track (TT), non-tenure track (NTT), and other types of employment over time.
In a recent post, we reported that our sample is evenly divided between grads employed in TT/NTT positions and grads employed in all other job types. We also noted that about 25% of the grads in our overall sample (and slightly more men than women) are currently employed in TT positions. However, these figures are averaged across all graduation years – does the story change when we look at earlier (versus more recent) grads?
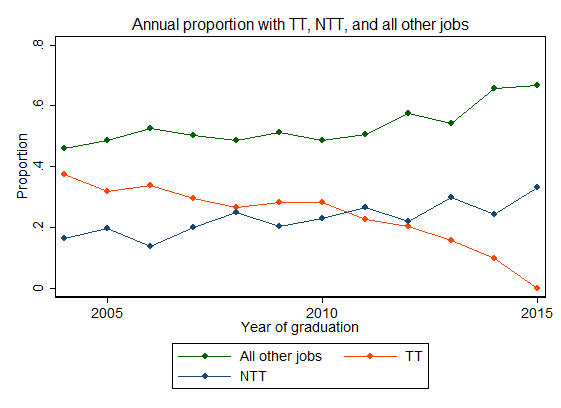
We assessed the proportion of grads in TT, NTT, and all other jobs in the overall sample:
And stratified by gender:
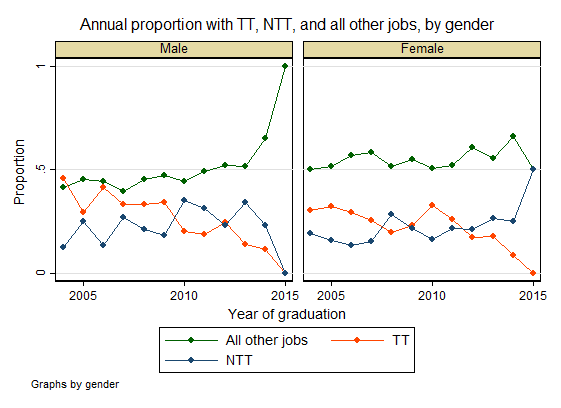
*Note: 2015 data is sparse and likely unreliable.
These plots suggest that the proportion of grads in TT positions decreases steadily as graduation year increases; we see similar patterns when we stratify by gender, although the proportion of women in TT positions is comparatively low among grads from earlier graduation years. There appears to be an overall increase in NTT employment over time, and a somewhat less pronounced increase in all other types of employment (although the upward trend in this category may be driven, to some extent, by inflated/unreliable 2015 data).
Taken together, these findings may reflect the employment payoffs of increased time on the job market, an overall decline in TT employment/position availability, or a combination of the two. Again, it’s important to acknowledge the potential for misclassification in our dataset given our reliance on publicly available data. Future work should aim to identify and select a representative cohort of grads and follow them over time – this would allow us to better assess whether temporal trends (i.e., shifts in job availability) are responsible for the observed patterns, or whether TT positions simply take more time to acquire.
Today, we take a closer look at the relationship between year of completion (as a rough proxy for time) and employment – specifically, patterns of tenure/tenure-track (TT), non-tenure track (NTT), and other types of employment over time.
In a recent post, we reported that our sample is evenly divided between grads employed in TT/NTT positions and grads employed in all other job types. We also noted that about 25% of the grads in our overall sample (and slightly more men than women) are currently employed in TT positions. However, these figures are averaged across all graduation years – does the story change when we look at earlier (versus more recent) grads?
We assessed the proportion of grads in TT, NTT, and all other jobs in the overall sample:
And stratified by gender:
*Note: 2015 data is sparse and likely unreliable.
These plots suggest that the proportion of grads in TT positions decreases steadily as graduation year increases; we see similar patterns when we stratify by gender, although the proportion of women in TT positions is comparatively low among grads from earlier graduation years. There appears to be an overall increase in NTT employment over time, and a somewhat less pronounced increase in all other types of employment (although the upward trend in this category may be driven, to some extent, by inflated/unreliable 2015 data).
Taken together, these findings may reflect the employment payoffs of increased time on the job market, an overall decline in TT employment/position availability, or a combination of the two. Again, it’s important to acknowledge the potential for misclassification in our dataset given our reliance on publicly available data. Future work should aim to identify and select a representative cohort of grads and follow them over time – this would allow us to better assess whether temporal trends (i.e., shifts in job availability) are responsible for the observed patterns, or whether TT positions simply take more time to acquire.
Discussion
I’m wondering if these charts take in to consideration the number of graduate students admitted into doctoral programs each year. Is the rate of TT decreasing because the rate of admittance is increasing?
We don’t control for admittance rates here, but it’s certainly possible that they play a role in the TT decline. I think the major driver here is time on the job market (if we look back at the 2014 grads in a few years, the proportion working in TT positions will likely be much higher). However, it’s unclear if the slope of that line, or the rate of increase in TT employment within a cohort over time, will mirror the rates of earlier cohorts. If these patterns diverge, we might want to investigate whether other factors (including admittance rates, as you suggest) play an important role in TT trends over time. Unfortunately we can’t assess this using our current dataset, but it would be very interesting to look at these patterns moving forward – great question!