Many (but not all) PhD grads hope to secure jobs in higher education upon completion. We looked to our data, which contains occupation information for about 80% of our total sample, to find out 1) how many people are currently working in higher education, and 2) which other types of employment are particularly common among humanities PhDs. Our “higher education” category includes full-time professors (tenured/tenure-track), postdoctoral fellows, research fellows, administrators, and other contract positions.
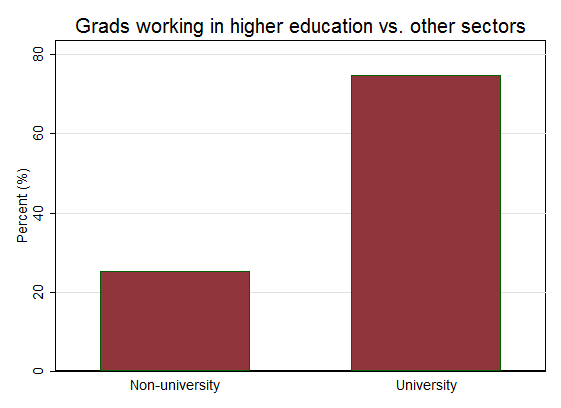
The majority (75%) of our sample grads currently work in higher education. Within this group, 43% are employed as university professors; this percentage will likely increase over time given our sample’s wide range of graduation years.
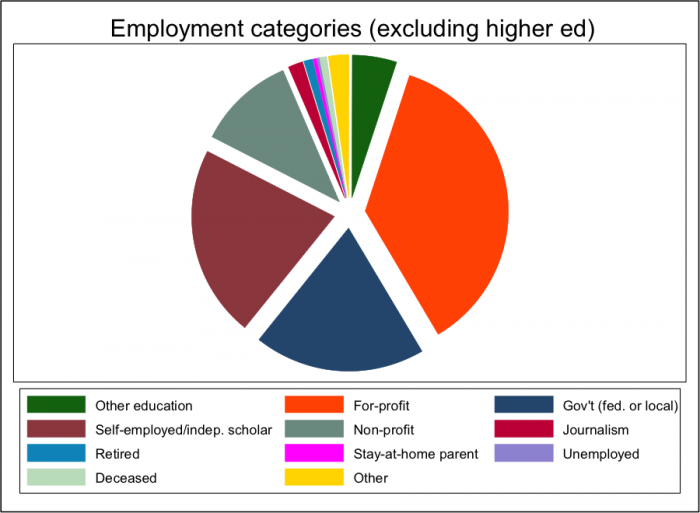
There is considerable variability among the 25% of graduates (n=480) working outside of higher education. The plot below shows the breakdown by category and illustrates a few common trajectories: 36% of our grads currently work in the for-profit sector, 20% are self-employed, 19% work in federal or local government, and 11% work in the non-profit sector.
We’ll take a closer look at employment patterns and gender differences in upcoming posts – stay tuned!
Many (but not all) PhD grads hope to secure jobs in higher education upon completion. We looked to our data, which contains occupation information for about 80% of our total sample, to find out 1) how many people are currently working in higher education, and 2) which other types of employment are particularly common among humanities PhDs. Our “higher education” category includes full-time professors (tenured/tenure-track), postdoctoral fellows, research fellows, administrators, and other contract positions.
The majority (75%) of our sample grads currently work in higher education. Within this group, 43% are employed as university professors; this percentage will likely increase over time given our sample’s wide range of graduation years.
There is considerable variability among the 25% of graduates (n=480) working outside of higher education. The plot below shows the breakdown by category and illustrates a few common trajectories: 36% of our grads currently work in the for-profit sector, 20% are self-employed, 19% work in federal or local government, and 11% work in the non-profit sector.
We’ll take a closer look at employment patterns and gender differences in upcoming posts – stay tuned!
Discussion